Ever wanted to simply draw diagrams or flowcharts and avoid heavy tools like Visio.? Mermaid is one of the tool comes very handy here. Amazingly simple text like language, which can be learnt in very small time and you are already creating stunning diagrams. Generating of charts from text is very simple with Mermaid. Besides, this is well supported in a number of publishing systems and editors. Mermaid can be rendered directly from those supported editors. Finally, you actually do not need any of those editors or plugged in systems, but can also be directly used. Online mermaid editor
You can try your learning and implementations on the link itself. Is not it awesome!?
This is open source program and you feel free to contribute in documentations or coding. Following are the links if you are interested in documentation or coding.
- Contribute to mermaid: https://github.com/knsv/mermaid
- Contribute to documentation: https://github.com/mermaidjs/mermaid-gitbook
Mermaid supports flowchart, sequence diagrams and gantt chart.Sequence diagram is used for software development and normally is not required or used in normal other businesses so we will focus on flowchart and gantt diagram in this article.
Ok so let's begin our journey to write our diagram.
Flowcharts
The diagram compositions can be divided in 3 major parts.
- Graph
- Notes or shapes
- Links
Graph
First part is graph which will hold the entire information about the diagram it starts with the word graph followed by two letters that denotes the direction of the arrows of the picture
Direction may be
- Top to bottom or down, represented by TD or TB.
- Bottom to top represented by BT
- Right to left represented by RL
- Left to right represented by LR
Example start line is Graph TD
Nodes or shapes
Nodes or shapes are the basics of a diagram. Mermaid supports a lot of shapes which can be symbolised in simple texts.The basics shape is a rectangle and that is the default one. You do not need to mention about the shape if you want to have a rectangular shape.
The node has three parts.
- First one is the ID. It is a single word without spaces but support dash (-). Minimum one node is needed for a diagram. ID is case sensitive. So ID A is not same as a.
- Second comes the shape of the node, which is denoted by pair of square brackets, curly brackets or parenthesis or combination of this.
- Third is the Label. ID is default label, unless we have a text enclosed in the shape-denoting brackets. The label is the text which are enclosed in brackets, parenthesis or curly brackets.
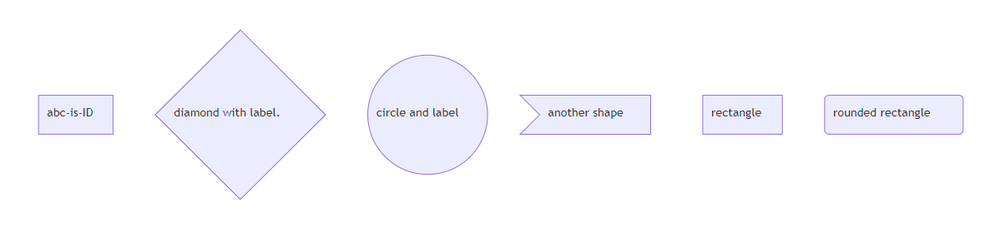
Let me show you some examples of different shapes with text before we go to the next section.
graph TD
   abc-is-ID
   b{diamond with label.}
   c((circle and label))
   d>another shape]
   e[rectangle]
   f(rounded rectangle)
Links
this is used to do linking between nodes nodes can be connected with leaves or ages it is possible to have different types of links the links can also contain texts. Link can be open so no direction.directional links will have arrowhead. link line type Candy solid line dotted line or a bold line a thick line let me give some examples of all these types
The main graph can have child those are called subgraph and subgraph can have known and links connecting inside or outside of the subgraph path within the main graph here is an example.
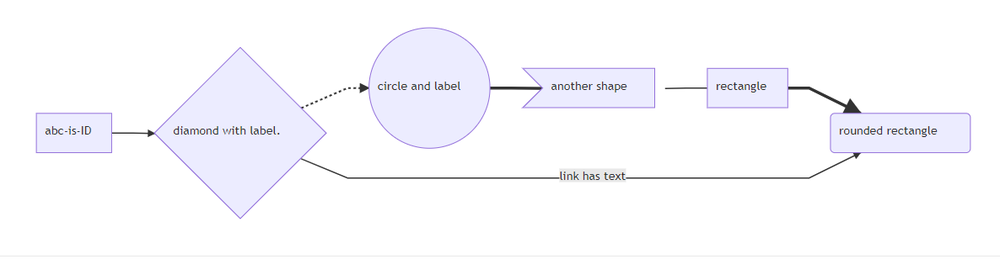
1 2 3 4 5 6 7 8 9 10 11 12 13 14 | graph LR
abc-is-ID
b{diamond with label.}
c((circle and label))
d>another shape]
e[rectangle]
f(rounded rectangle)
abc-is-ID-->b
b-.->c
c===d
d---e
e==>f
b-->|link has text|f
|
Advanced Topics
Basic support for fontawesome
It is possible to add icons from fontawesome.
The icons are accessed via the syntax fa:#icon class name#.
Styling a node
It is possible to apply specific styles such as a thicker border or a different background color to a node.
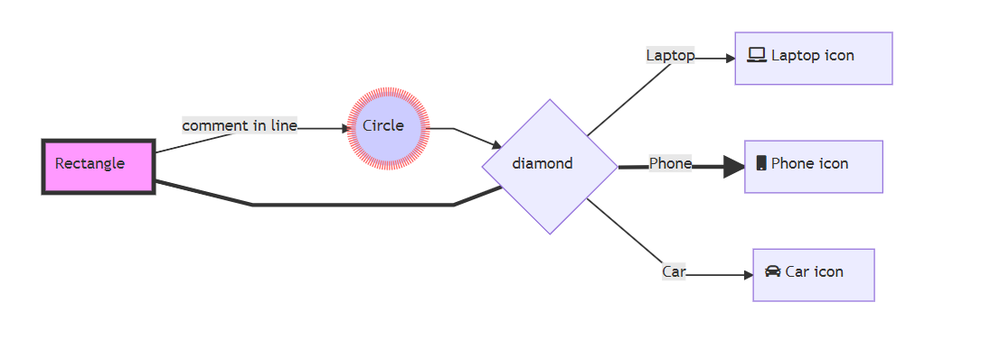
graph LR
   id1[Rectangle] -->|comment in line| id2((Circle))
   id2 --> C{diamond}
   C -->|Laptop| D[fa:fa-laptop Laptop icon]
   C ==>|Phone| E[fa:fa-mobile Phone icon]
   C -->|Car| F[fa:fa-car Car icon]
   id1===C


    style id1 fill:#f9f,stroke:#333,stroke-width:4px
    style id2 fill:#ccf,stroke:#f66,stroke-width:8px,stroke-dasharray: 1, 10
Gantt Chart
Gantt chart is more popular in project management practices. This creates a visual representation of task with their dependencies. These also shows the tasks which are in the critical path. Mermaid can be used conveniently to create visually stunning gantt chart.
Let's see how we can create a gantt chart in Mermaid.
Start of the chart
Gantt chart starts with the reserved word or keyword "gantt" in Mermaid . You will notice that we will be using few reserved words in Gantt chart preparation. Reserved words or keywords are the words which has a special meaning or interpretation by Mermaid when placed in specific places or positions. reserved words are case sensitive, small or uppercases needs to be used as mentioned here
Date format
Next, we have to use another reserved word dateFormat, to let mermaid understand the date format used in the diagram. so next line is starts with dateFormat followed by the format for example YYYY-MM-DD.
Title
Next, we have to define the title of a graph and this also starts with a a reserved word called title. It follows the actual title of the graph a diagram.
Section
After this section starts. Section can be thought about horizontal swim Lane or line where a group of task would be listed down. Each section starts with the word section followed by a sentence or group of words to define what that section will do. Anything follows on each line after the sections keyword task mermaid considers each line as a single task until it finds out a line starting with keyword section. when it finds another section that means next section would be starting.
Task
Now let's talk about the task. As explained, each line is a task. So, group of words or sentence that summarises the task is Task name or task summary. It followed by a colon (:) .
After colon whatever comes, are attributes of that task and all the attributes are separated by comma. The attributes that are defined after colon are positional, which means those has to appear in a sequences. Some attributes uses reserved words. Their positions and the sequences are fixed but can be omitted or skipped. One minimum thing that is required for a task in mermaid gantt chart is the duration. Duration could be in terms of days or hour or and absolute finish time.
First position after colon, is preserved for critical path and it is represented by a keyword crit.So, if the task is on the critical path, write crit, else skip the positions and go to the next.
next position is reserved for active task status. if the task is active or currently being worked upon, then write active, otherwise please skip the position.
next position is for the current status of the activity. if it is already done you can write the keyword done and otherwise skip that.
Next position is for the ID of the task. ID of the task is necessary when you want to define dependency of other subsequent task on this . Otherwise you can skip this.
Next position is used for start time of the task. It could be relative to some other task. In that case, we use a keyword after and it says like after the ID of the other task. It can also be an absolute date. if it is skipped then the start time is considered as the end time of the previous task.
The next field which is the last one is the only mandatory attributes for any task which is the duration of the task it can be expressed in hours or days or it can also be a specific date that is an absolute date.
You repeat creating tasks on subsequent lines until you think it would be an section. Then again the next section begins.
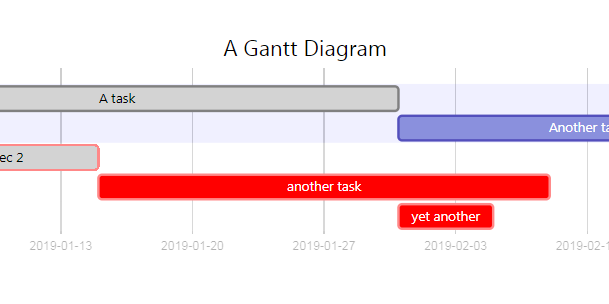
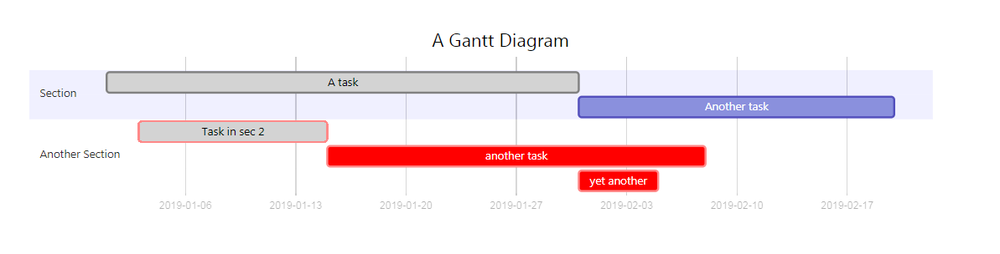
Lets's look into the following line of codes and the graph generated by the code. It should be self explanatory after reading the explanation above
gantt
    title A Gantt Diagram
    dateFormat  YYYY-MM-DD
    section Section
    A task           : done, a1, 2019-01-01, 30d
    Another task     :after a1  , 20d

    section Another Section
    Task in sec  2     : crit, done, s1, 2019-01-03,12d
    another task      :crit, s2, after s1,  24d
    yet another :crit, after a1, 5d
Hope, this was informative and could help you to get started. If you are interested to learn about GraphViz, which does flowcharts and have more granular controls you may want to ready my article Writing graph with GraphViz