GraphViz - Graph visualization Software
Open source graph visualisation software. It is used for representing structural informations as a graph. Writing structural information is easy. Knowing some simple syntaxes will get you started with graphviz.it takes the descriptions of graph in a simple text language called DOT Language and convert it into diagrams. The output image format maybe svg for web pages or PDF. Advanced options also support for colours fonts layouts line styles even hyperlinks or custom shapes.
graphviz comes with some softwares but the default one is Dot. Two basic concept for Graph that we would be talking about are edge and nodes. Think of nodes as shapes and the edge are the connector between those nodes. The GraphViz text language has definition of the shapes and edge
To start you would need to download GraphViz from gitlab. https://graphviz.gitlab.io/download/
GraphViz works on a number of platforms. Basic forms for creating graphs uses dot.exe in Windows and dot in other platforms
The Dot Language
The heart of the system is the text language called DOT Language. Any text editor will will do for writing the text. We just need to follow the syntaxes. First thing to be defined is a graph
Graph
Graph can be plain or directed. Directed graph by default uses arrow and non-directed graph does not.
it takes the following format
Graph name is optional
graph graphname {

}
OR

digraph graphname {

}
Node
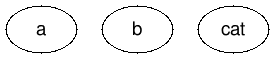
Following code produces the three independent nodes or shapes.
digraph graphname{
          a;
          b;
          cat;
       }
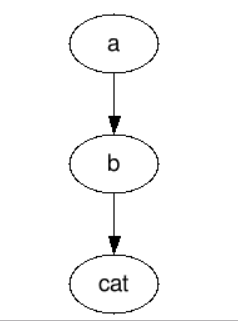
Edge
We already have the nodes now. Lets get those connected . We add -> between the nodes to get those connected
digraph graphname{
		a -> b ;
		b  -> cat;
}
Attributes
Now, that we have graph in place with node and we know how to connect the nodes. Let us go further to add some more details on the Nodes as well as edges
These are done by defining attributes. attributes can be for Graph, Node or edges. These are enclosed in two parenthesis, that is [ ] and separated by comma. These can be thought as properties. Following are some of the properties. It is not limited to this.
Example for set of attributes: [label ="deer", style=filled,color=blue, shape=egg, fontcolor=green]
Label
So far we have been using the ID of the nodes as the label to be put on the shapes. But labels can be explicitly set. Specially when you want to add spaces within the label. ID cannot accept spaces. example: label ="deer"
Shapes
Lots of predefined shapes can be used examples are : box, polygon, ellipse, oval, circle, point, egg, triangle, plaintext, diamond, trapezium, parallelogram, house, pentagon, hexagon, doublecircle, doubleoctagon, tripleoctagon
Style
Style may be "dashed", "dotted", "solid", "invis" and "bold" etc.
Color and fontcolor
you imagine and it is there . Full list available at here
Arrowtail and arrowhead
Some of the attributes are explicit for the edges. Arrowtail and arrowhead are of those kind. Box, crow, diamond, dot, inv, none, normal, tee, vee etc. are the options.
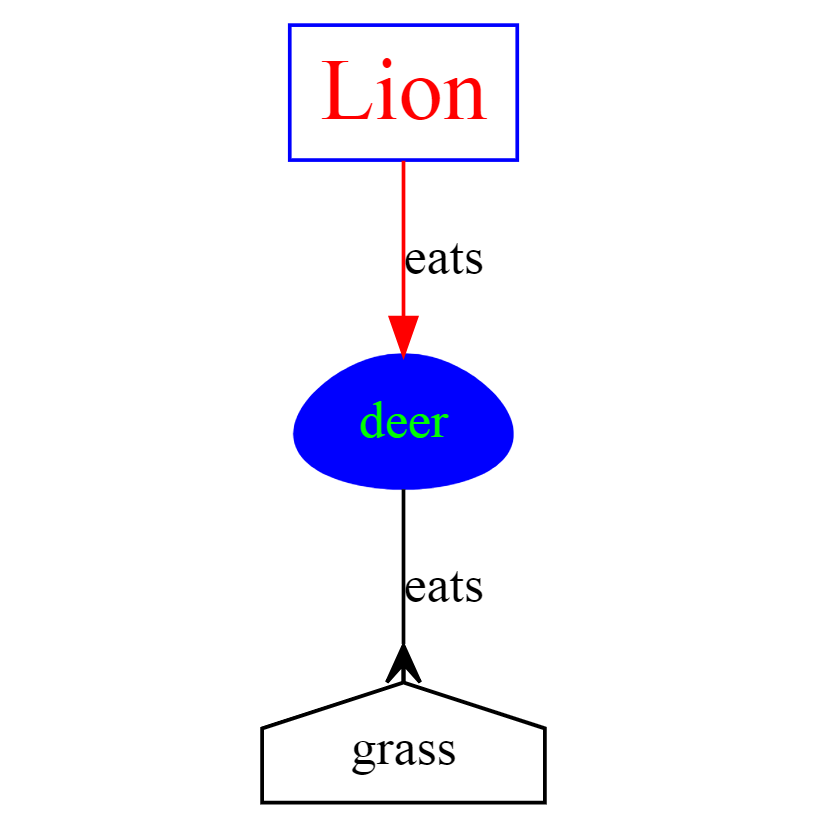
Let us now experience some examples of attributes
digraph graphname{
       a [label="Lion" color=Blue, fontcolor=Red, fontsize=24, shape=box] ;
       b [label ="deer", style=filled,color=blue, shape=egg, fontcolor=green];
       grass    [shape=house, ]

       a -> b  [label = "eats", color=red];
       b  -> grass [label = "eats", arrowhead="crow"];
}
Subgraph cluster
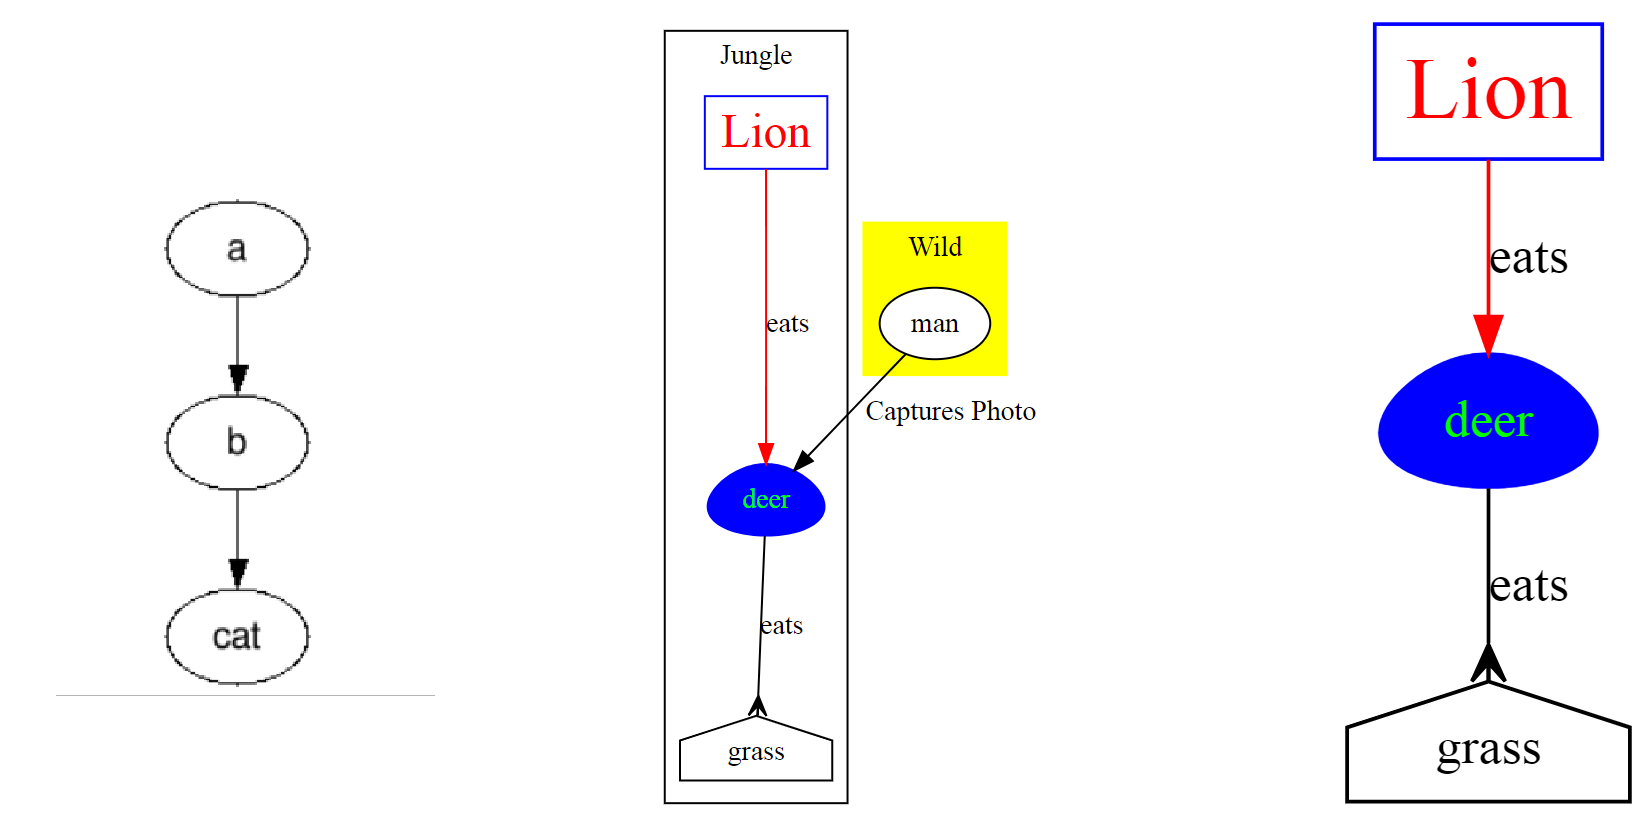
This is the last thing that I would like to touch upon in this article. This is basically graph within graph. There are some attributes like color etc are also applicable to subgraph. Please make a note that subgraph ID or name must start with "cluster".
digraph {


    subgraph cluster_0 {
       label="Jungle";

        a [label="Lion" color=Blue, fontcolor=Red, fontsize=24, shape=box] ;
        b [label ="deer", style=filled,color=blue, shape=egg, fontcolor=green];
        grass[shape=house ];
		a -> b  [label = "eats", color=red];
		b  -> grass [label = "eats", arrowhead="crow"];
    }

    subgraph cluster_1 {
        label="Wild";
        style=filled;
        color=yellow;
     man[style=filled, fillcolor=white]
     }

man  -> b[label="Captures Photo"];

  }
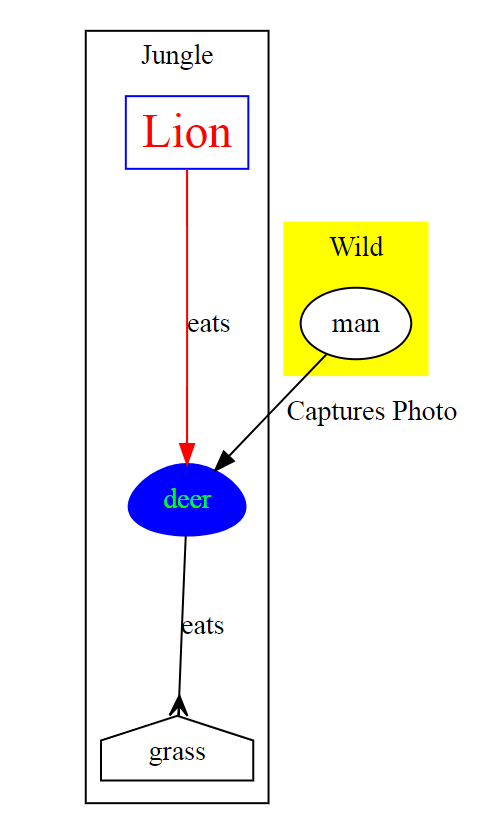
In the above example we created two subgraph named cluster_0 and cluster_1. They have nodes within that, same as previous examples.
This article should you get started with graphviz. you can refer to graphviz websites for moe examples and use cases.
Hope this was helpful. If you are interested in mermaid, which also supports text language and besides flowcharts can also create gantt and sequence diagrams, you may read my article Create diagrams, flowcharts or gantt from text with mermaid